CASE STUDY
Corebridge
I lead the redesign of multiple financial planning and retirement products at Corebridge Financial for individuals, plan sponsors, advisors, and internal employees, including SponsorFIT, the plan sponsor administration platform used by HR heads, retirement specialists, and benefits administrators. I also lead the design system spanning React/Bootstrap web, SLDS 2, React Native mobile (iOS and Android), and email.
MY ROLE
As UX Lead Designer, my responsibilities include:
KEY INITIATIVES
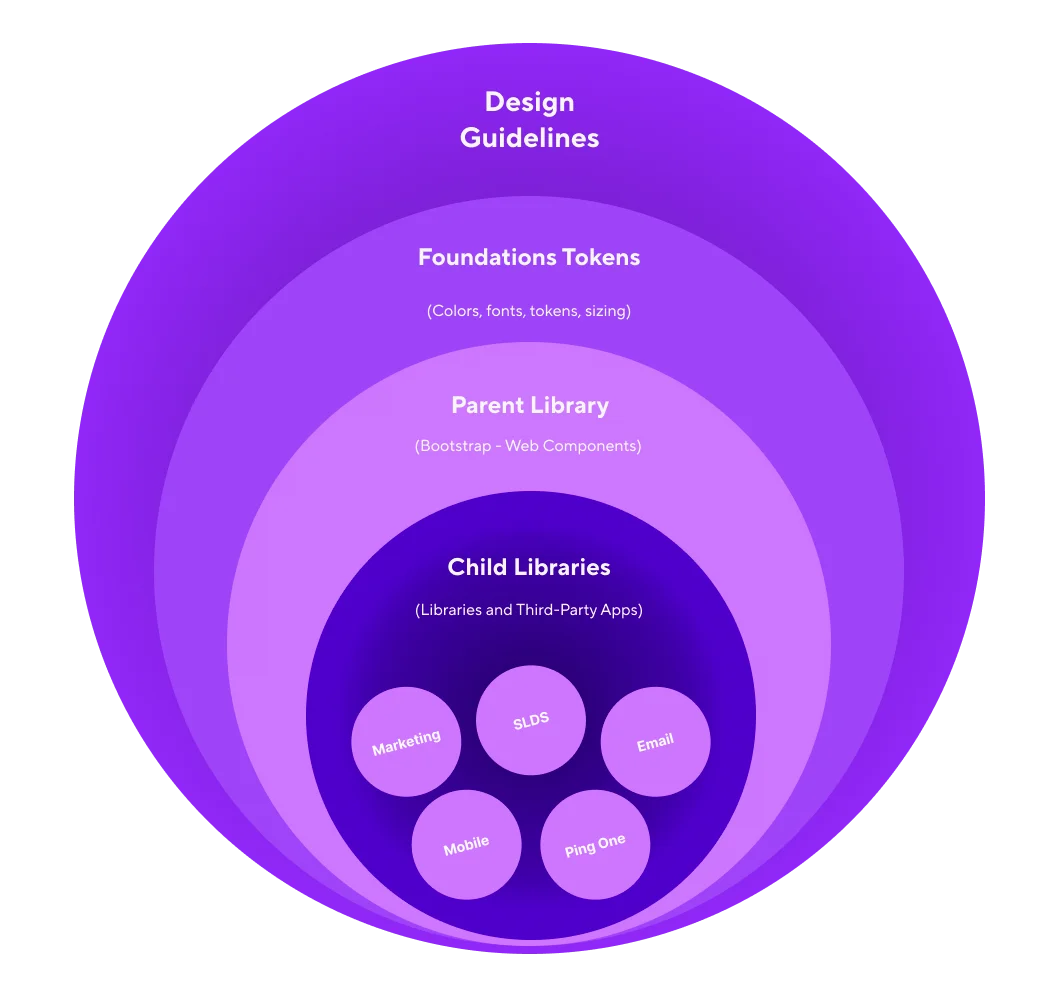
One design system, four platforms
I built a Figma architecture around a Brand Foundation library of primitive tokens for type, color, spacing, and stroke, aliased by each platform library. The hierarchy runs primitive → alias → component and feeds CSS custom properties on web. This mapping also lets us leverage AI tools more easily through MCP, connecting design and code more seamlessly.
Mobile is its own library rather than an extension of Bootstrap, since React Native’s Flexbox-only, touch-first model doesn’t map to the DOM.
A reporting platform built for plan sponsors
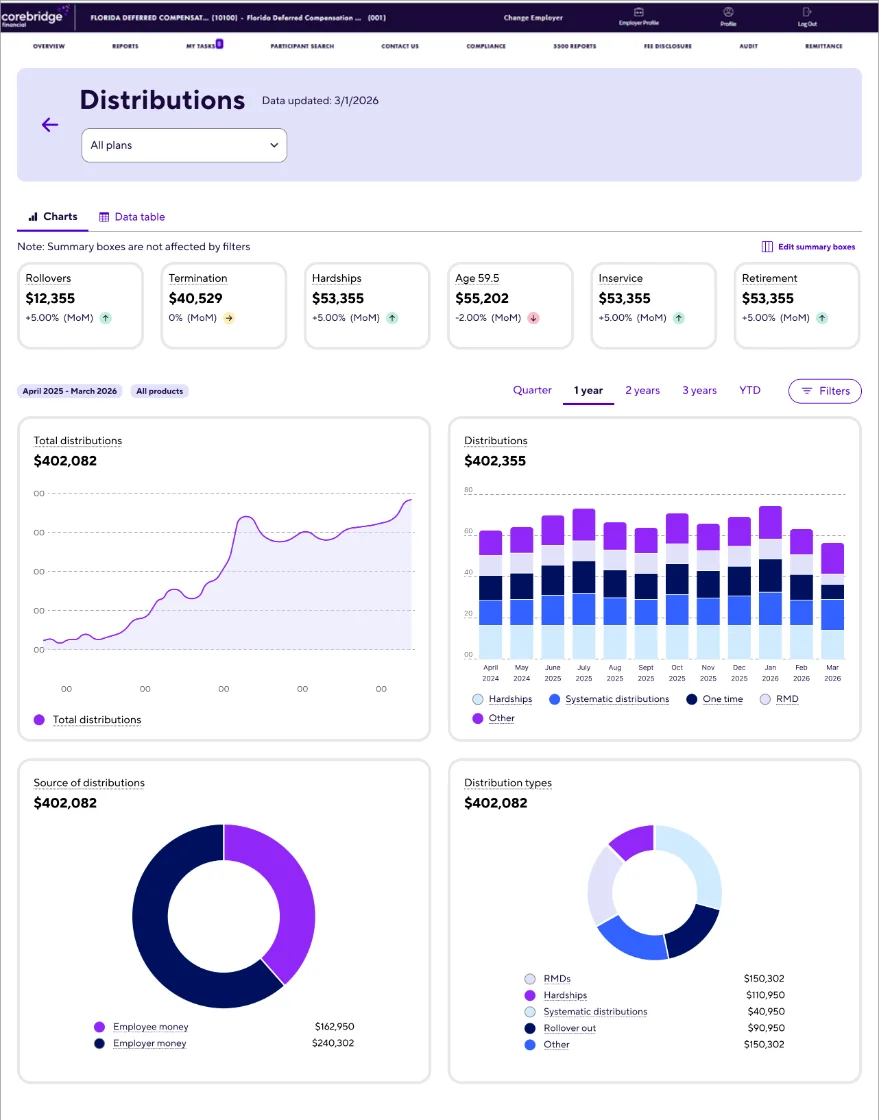
I designed a custom reporting platform that moved plan sponsor data out of an off-the-shelf BI tool and onto a front end we control, so the experience, the roadmap, and accessibility are no longer limited by a vendor.
Every report meets WCAG standards, and new interactive charts and graphs, built on Recharts, reveal the underlying values on hover, so sponsors can read exact numbers without leaving the visualization.
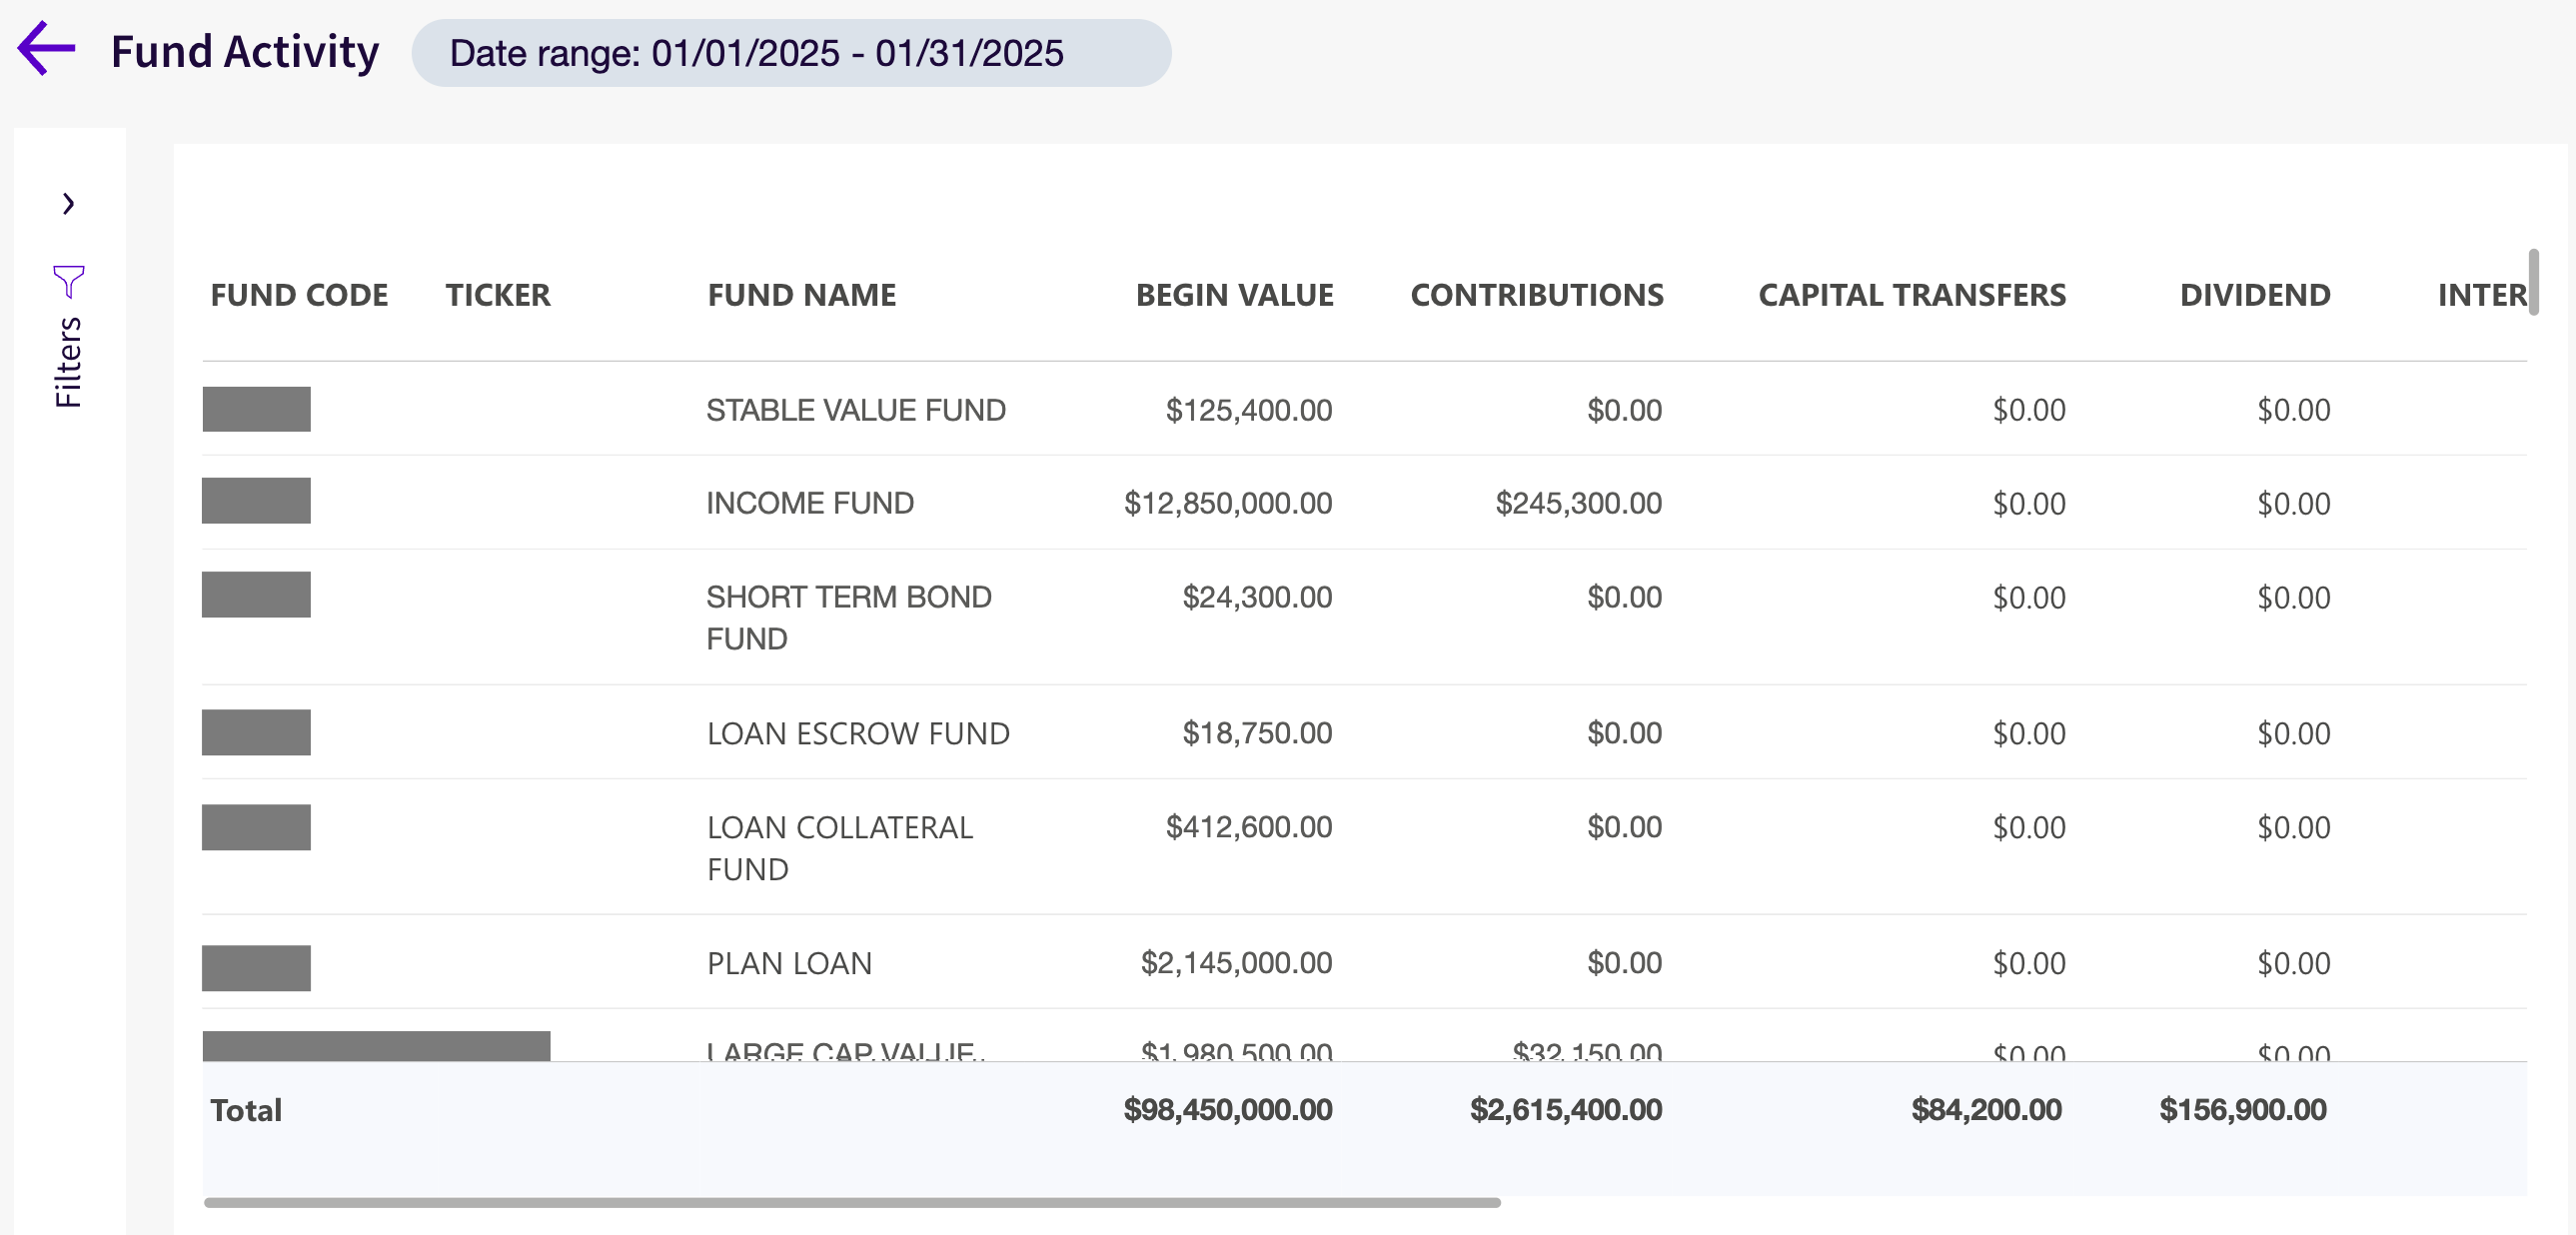
Rebuilt data tables let users customize which columns appear and download results faster, turning a static report into a tool they can shape to their own needs.
Before development began, I interviewed plan sponsors using static mockups of the new reporting interface. The sessions confirmed the layouts, terminology, and workflows matched how sponsors actually review plan data, and surfaced gaps while changes were still inexpensive. While the overall design and approach were validated, feedback led to a tab-based structure that separates charts from data tables, improving users’ mental model and the discoverability of multiple data table reports.
During the beta, I partnered with our analytics teams to build a measurement framework that combines Adobe Analytics with server logs. It shows which reports sponsors rely on, how they use the charts and tables, and where needs remain unmet, giving the roadmap a basis in real usage.
Accessibility built into the palette
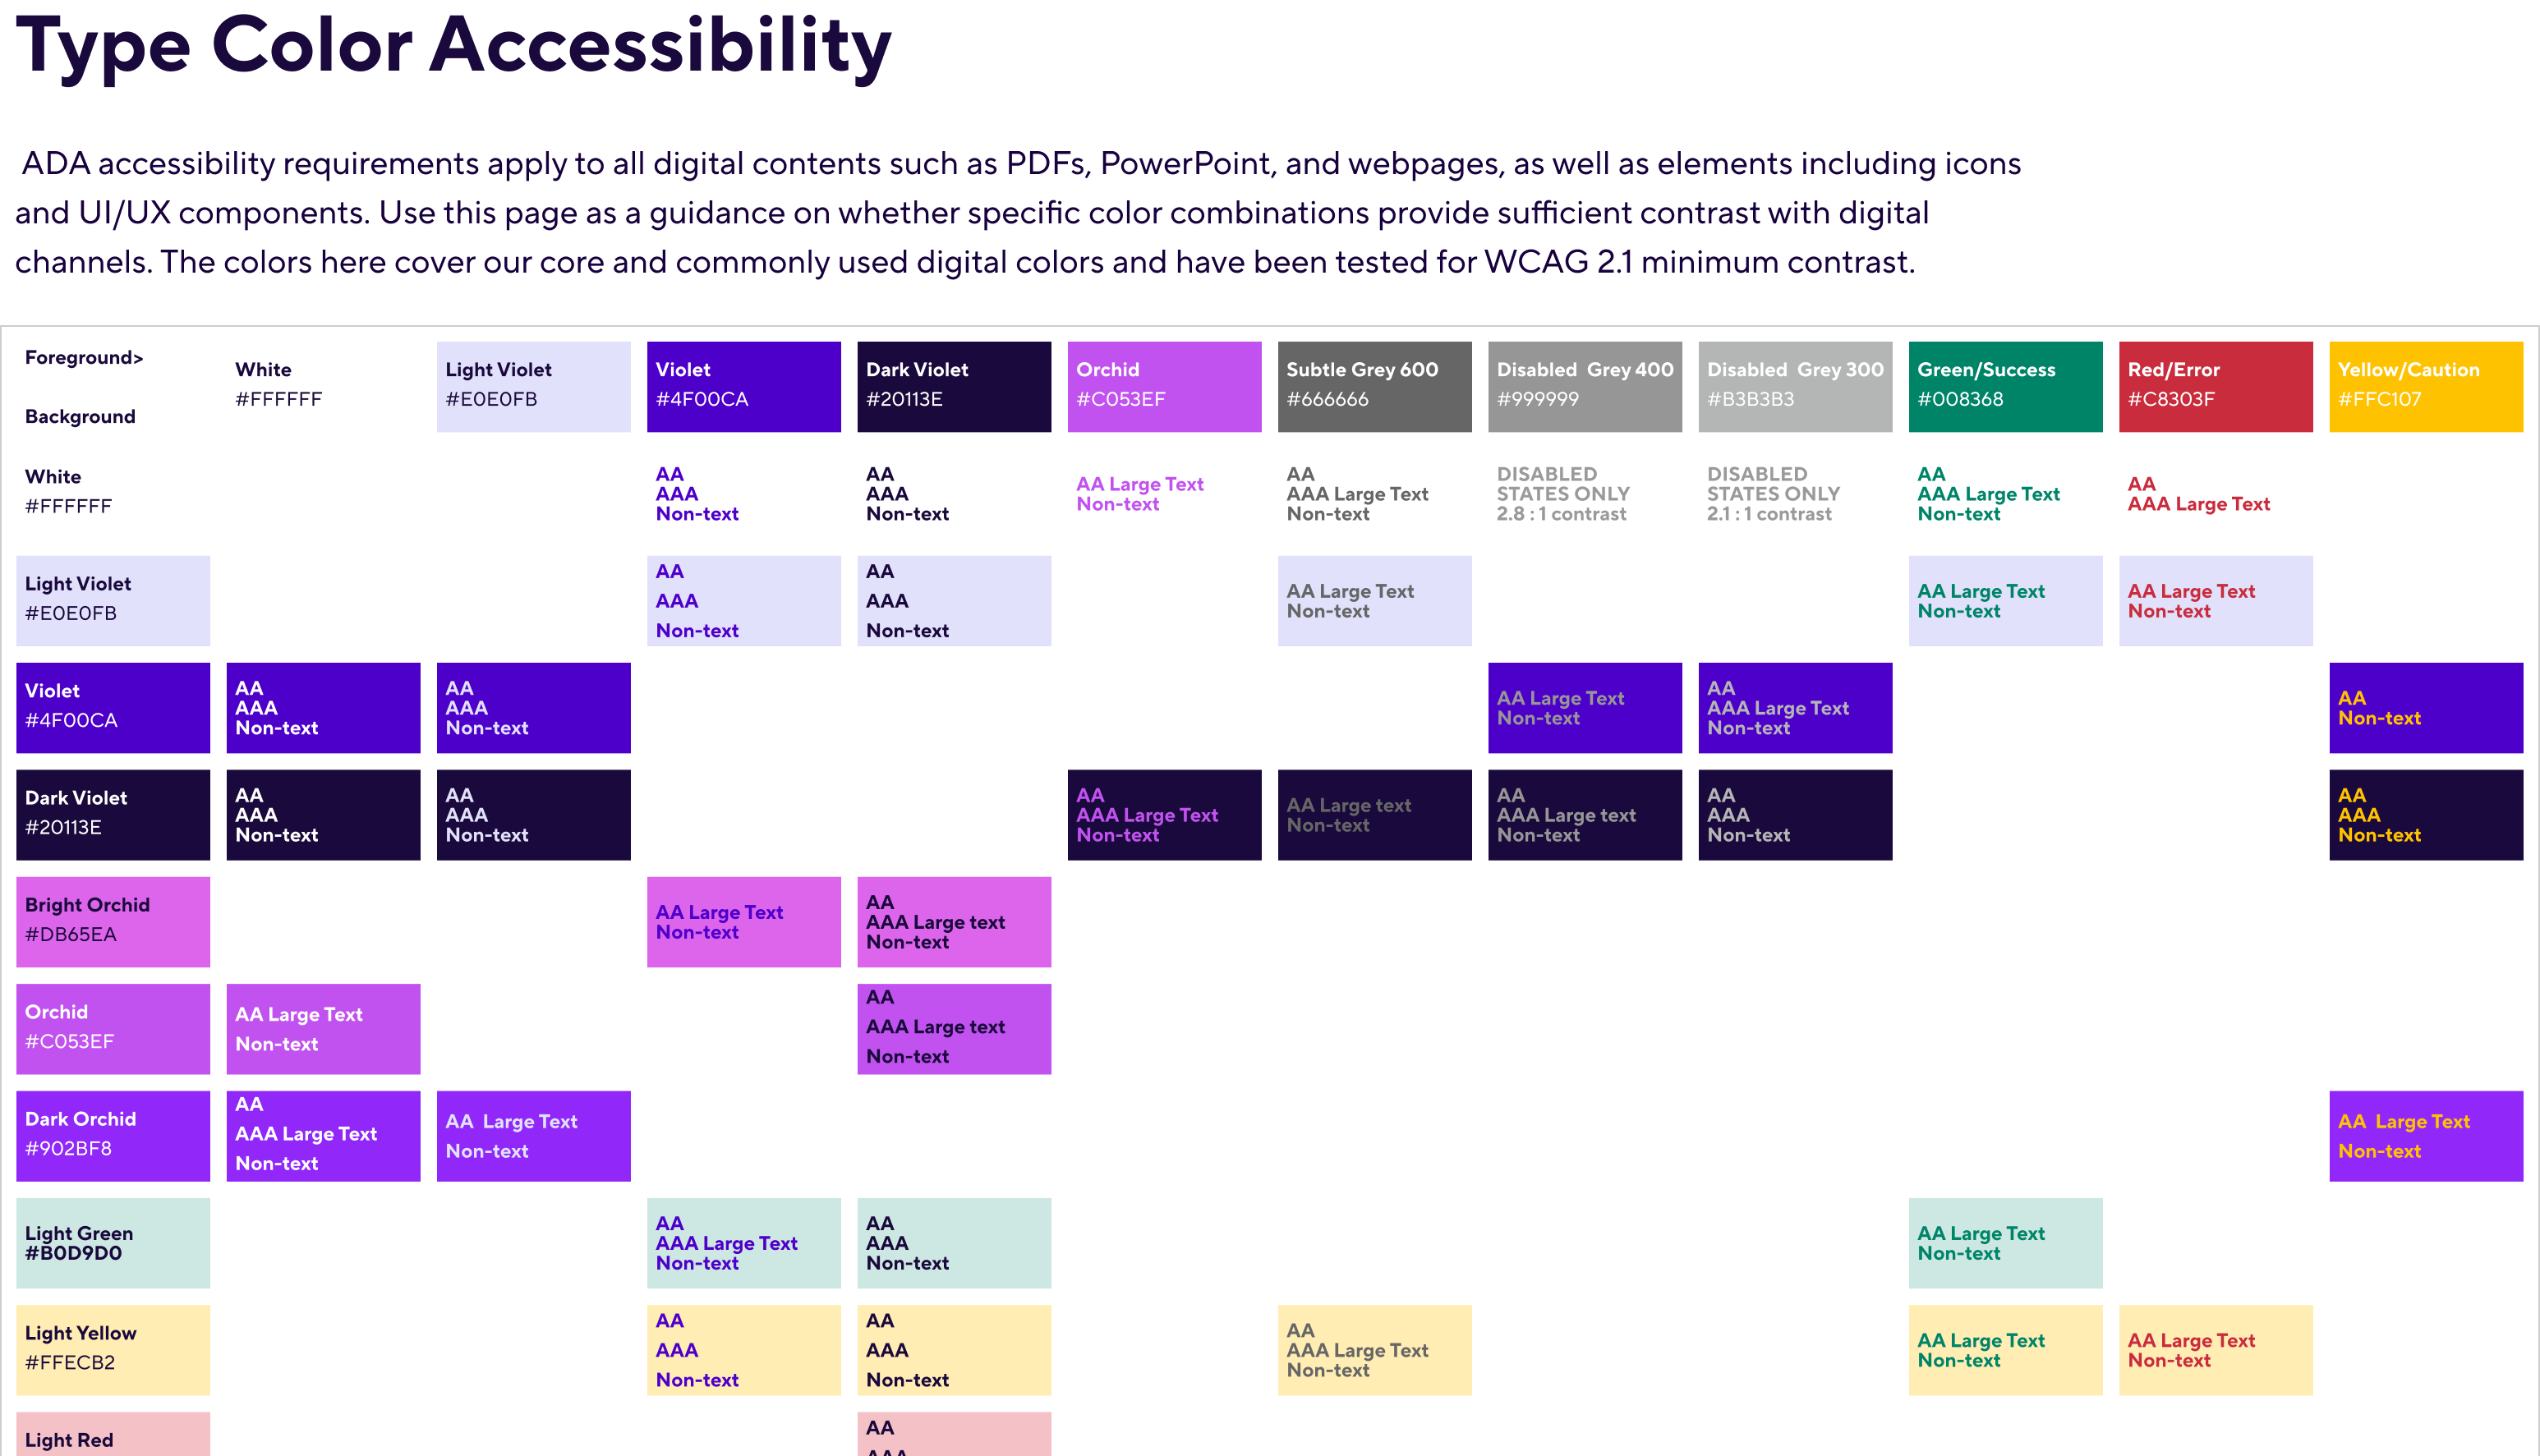
Accessibility starts with color. I built a type color accessibility matrix that tests every core foreground and background pairing in the digital palette against WCAG 2.1 minimum contrast, rating each combination for AA, AAA, large text, and non-text use.
Designers, developers, and content authors use it as a single reference across webpages, PDFs, PowerPoint, icons, and UI components, so contrast decisions are settled before work reaches review. Disabled states are flagged separately, keeping low-contrast greys out of active UI.
A wealth portal built around the advisor relationship
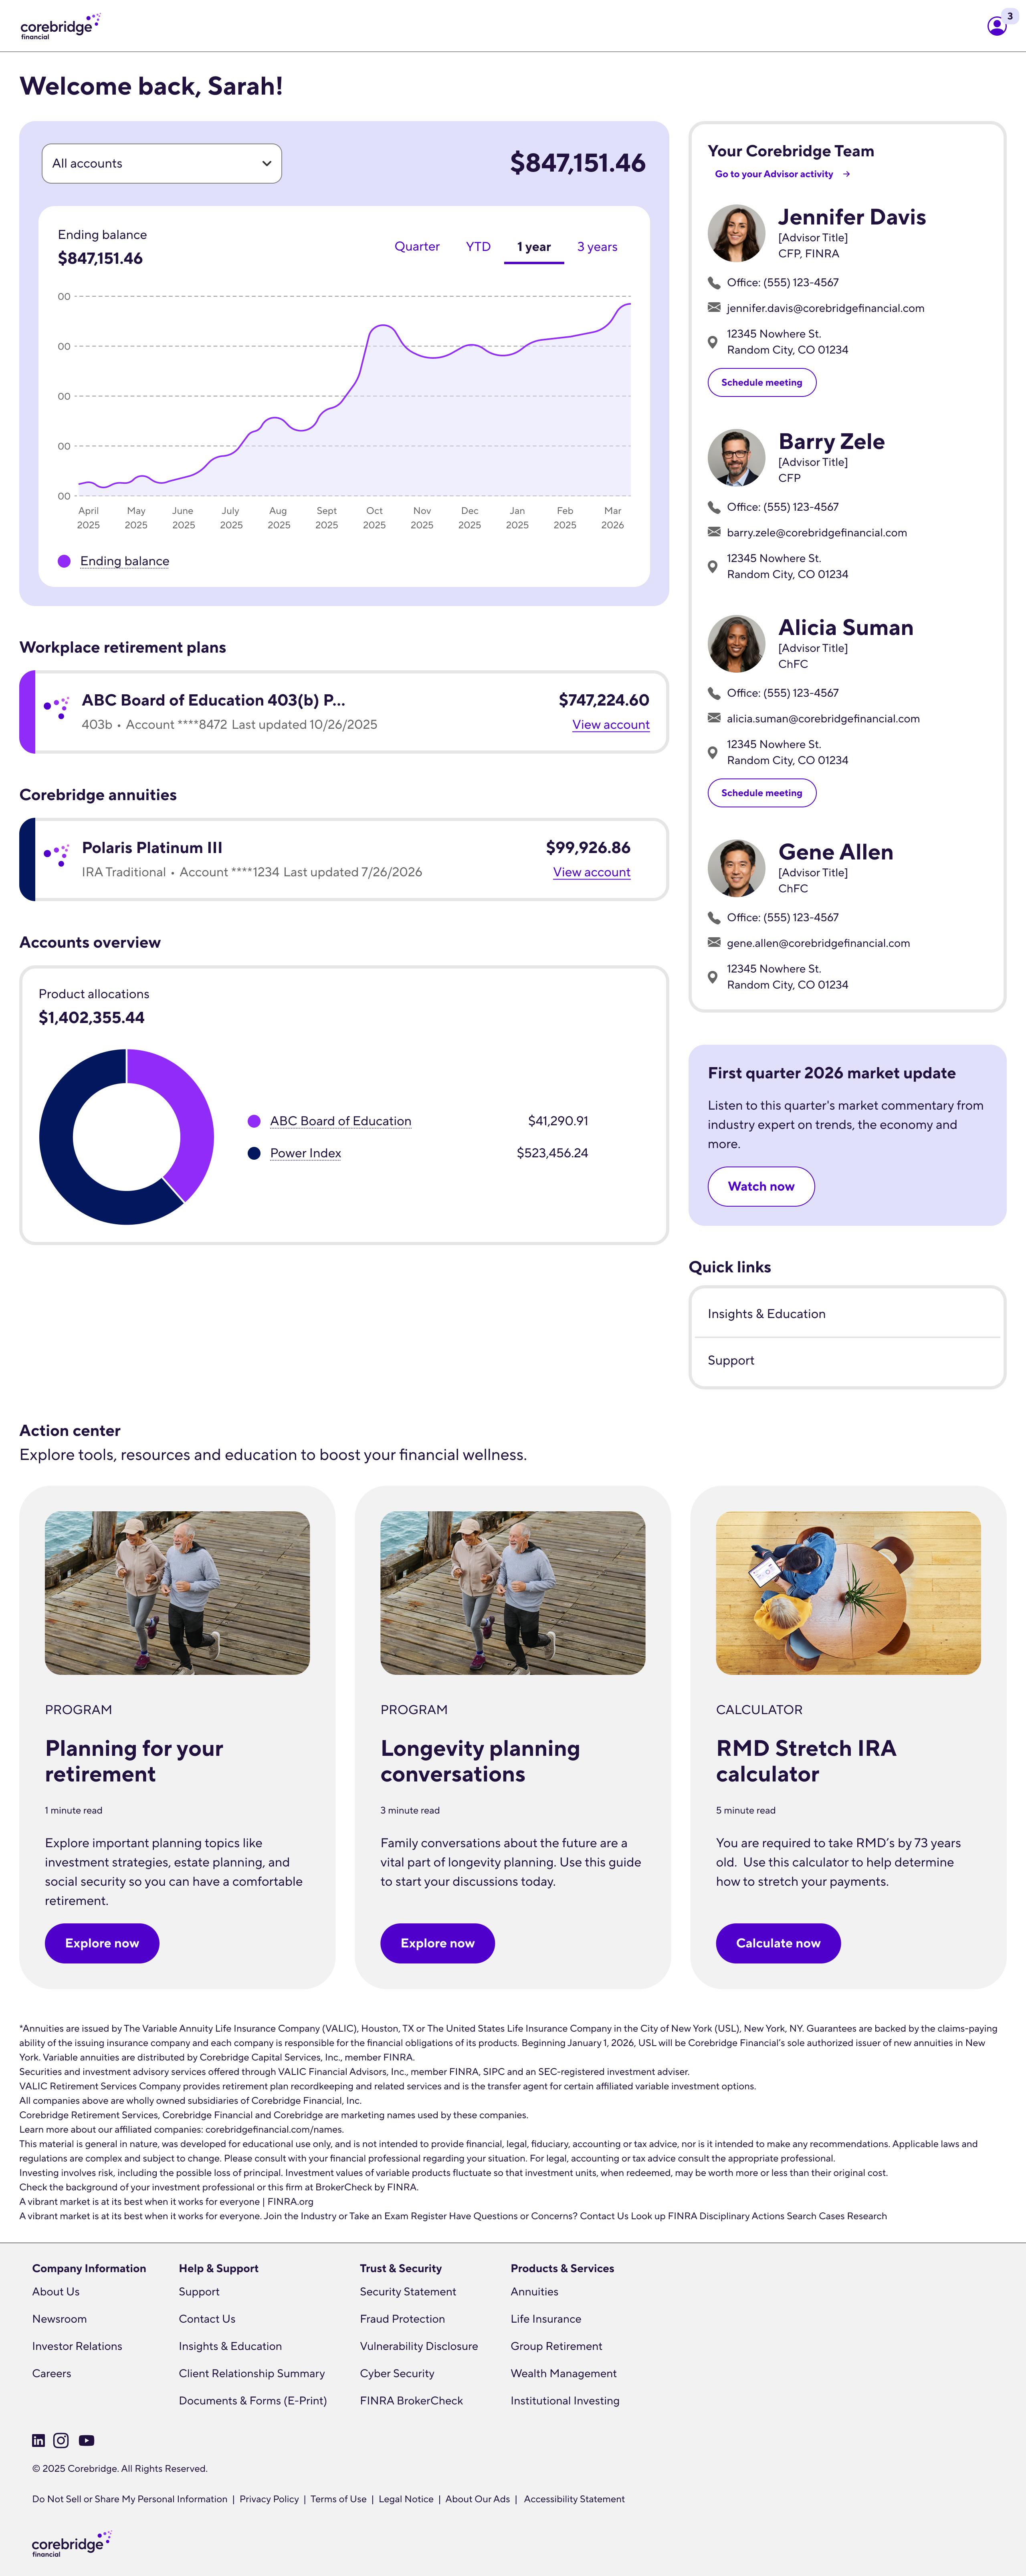
I designed a new Wealth Management portal that gives clients one view of everything they hold. A consolidated account graph tracks ending balance across quarter, YTD, one-year, and three-year ranges, and an allocation chart shows how assets are spread across products.
New advisor cards put every member of a client’s Corebridge team one click away, with contact details and meeting scheduling. A dedicated Advisor activity page adds upcoming appointments and a filterable history of every call, email, and meeting with their advisors.
Contact Me
I’m exploring UX Director and senior product design roles. Let’s talk about what your team is building.